Looking for a Needle in a Haystack: Genetic Markers with Relevance Across Species
We used powerful computer programs to analyse millions of pieces of DNA from the organisms we collected. We were looking for changes in the DNA called SNPs (short for Single Nucleotide Polymorphisms) that appeared across all of them. These small differences can reveal important information, so we focused on the ones most useful for answering the questions in our research.
The objective of this project was to determine the geographic distribution and taxonomic boundaries of the genus Urotrygon in the Mexican Pacific using DNA data. The taxonomy of this genus is fairly complex, confusing, and inadequate, often leading to misidentification among different species.
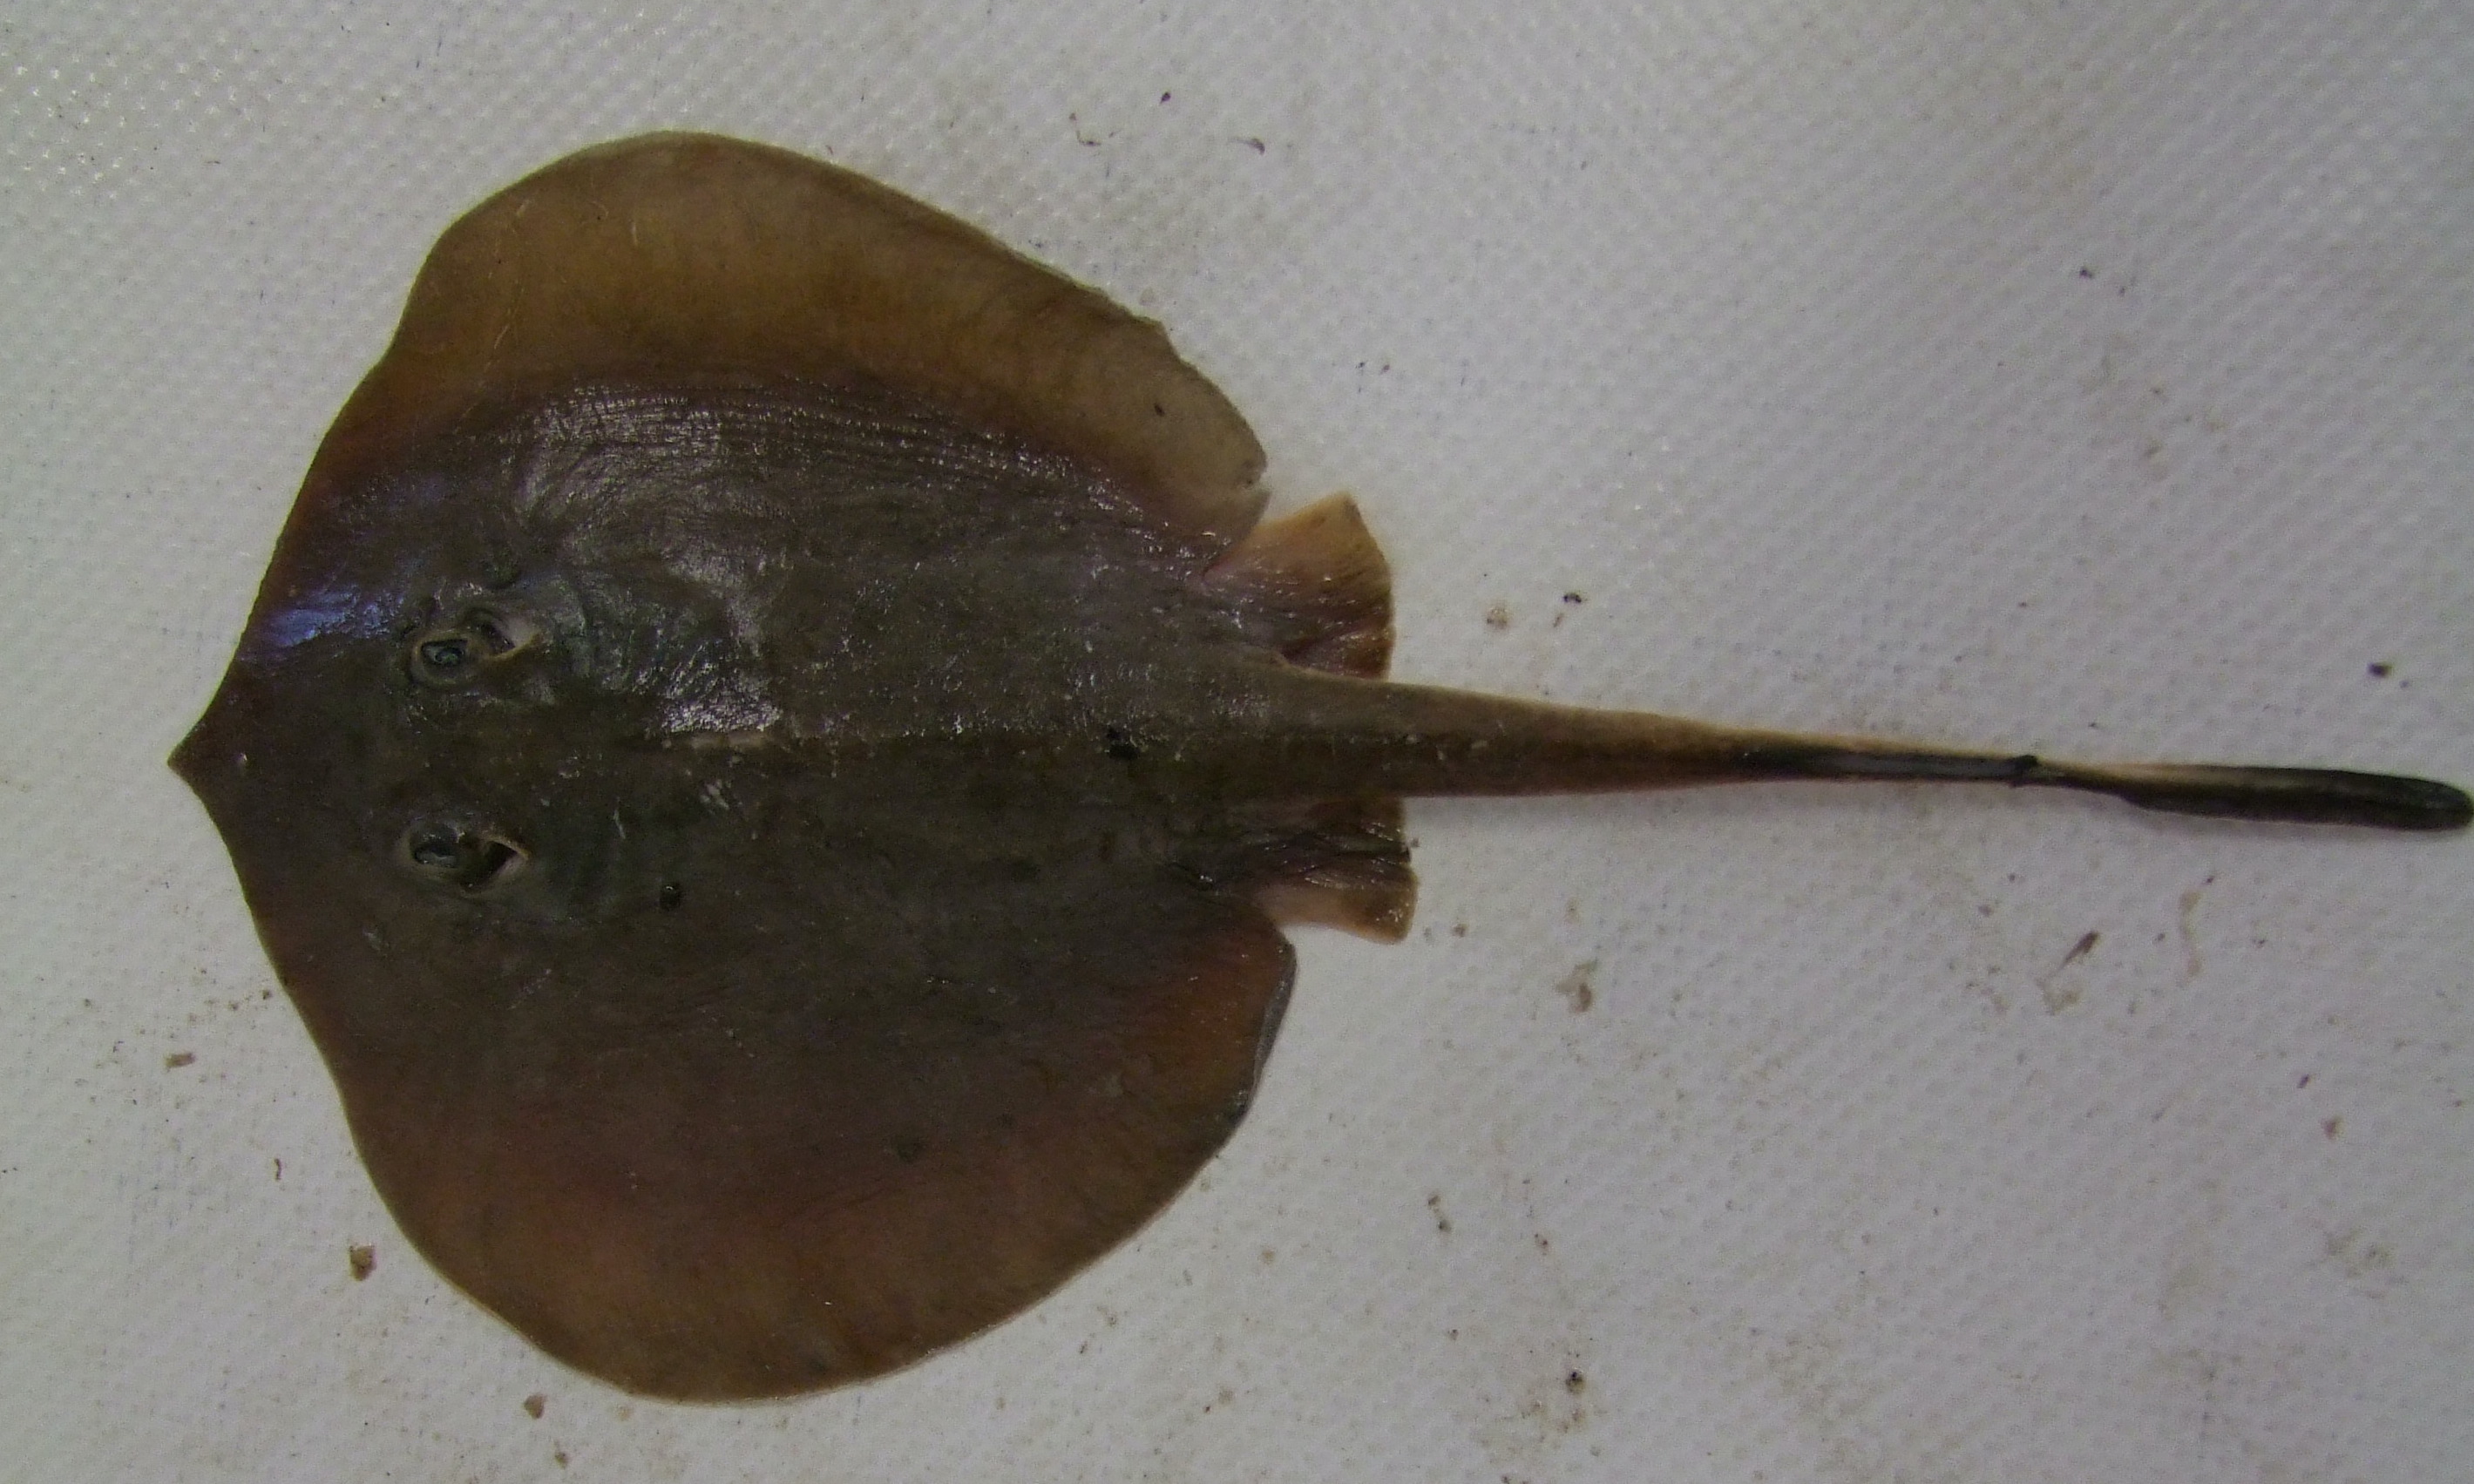
Dorsal view of Urotrygon chilensis. Photo © Javier Tovar
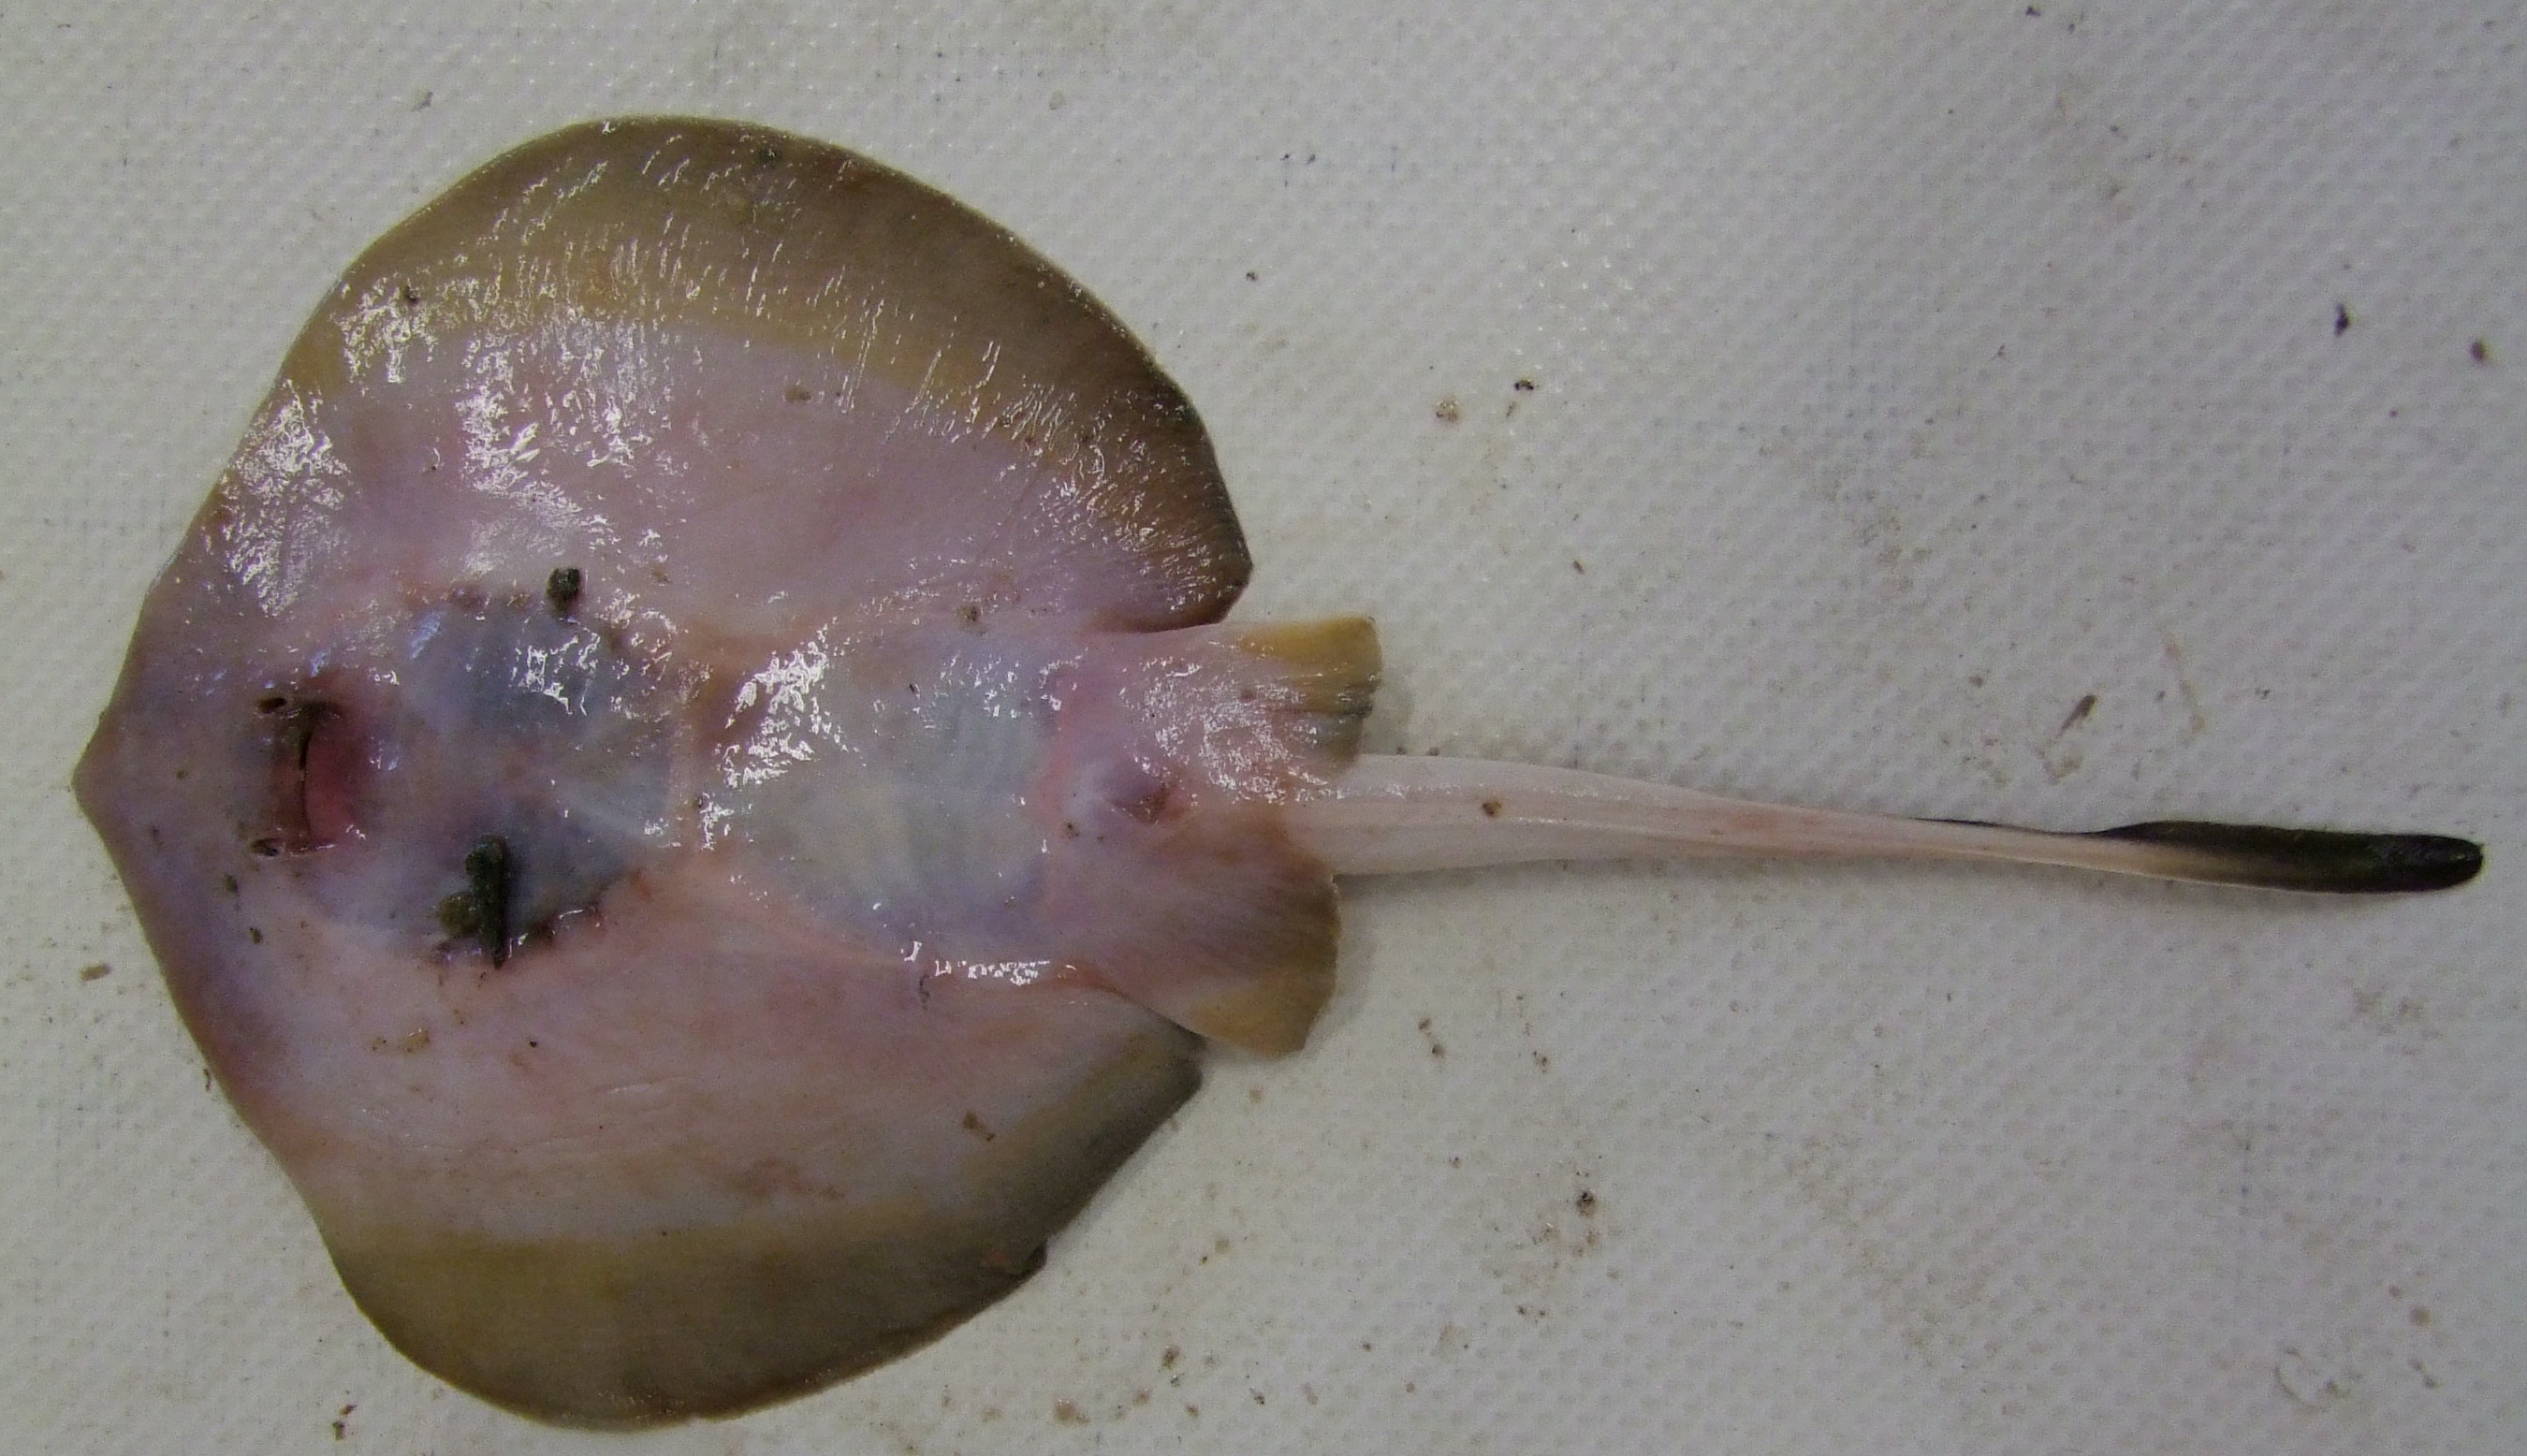
Ventral view of Urotrygon chilensis. Photo © Javier Tovar
First, we cleaned up our data by removing any DNA sequences that were unclear or low quality. Then, we adjusted our analysis to keep as many reliable DNA differences as possible. Finally, we decided how many individuals needed to share a certain DNA change for it to be considered important—both within a single species and across all the species we were studying.
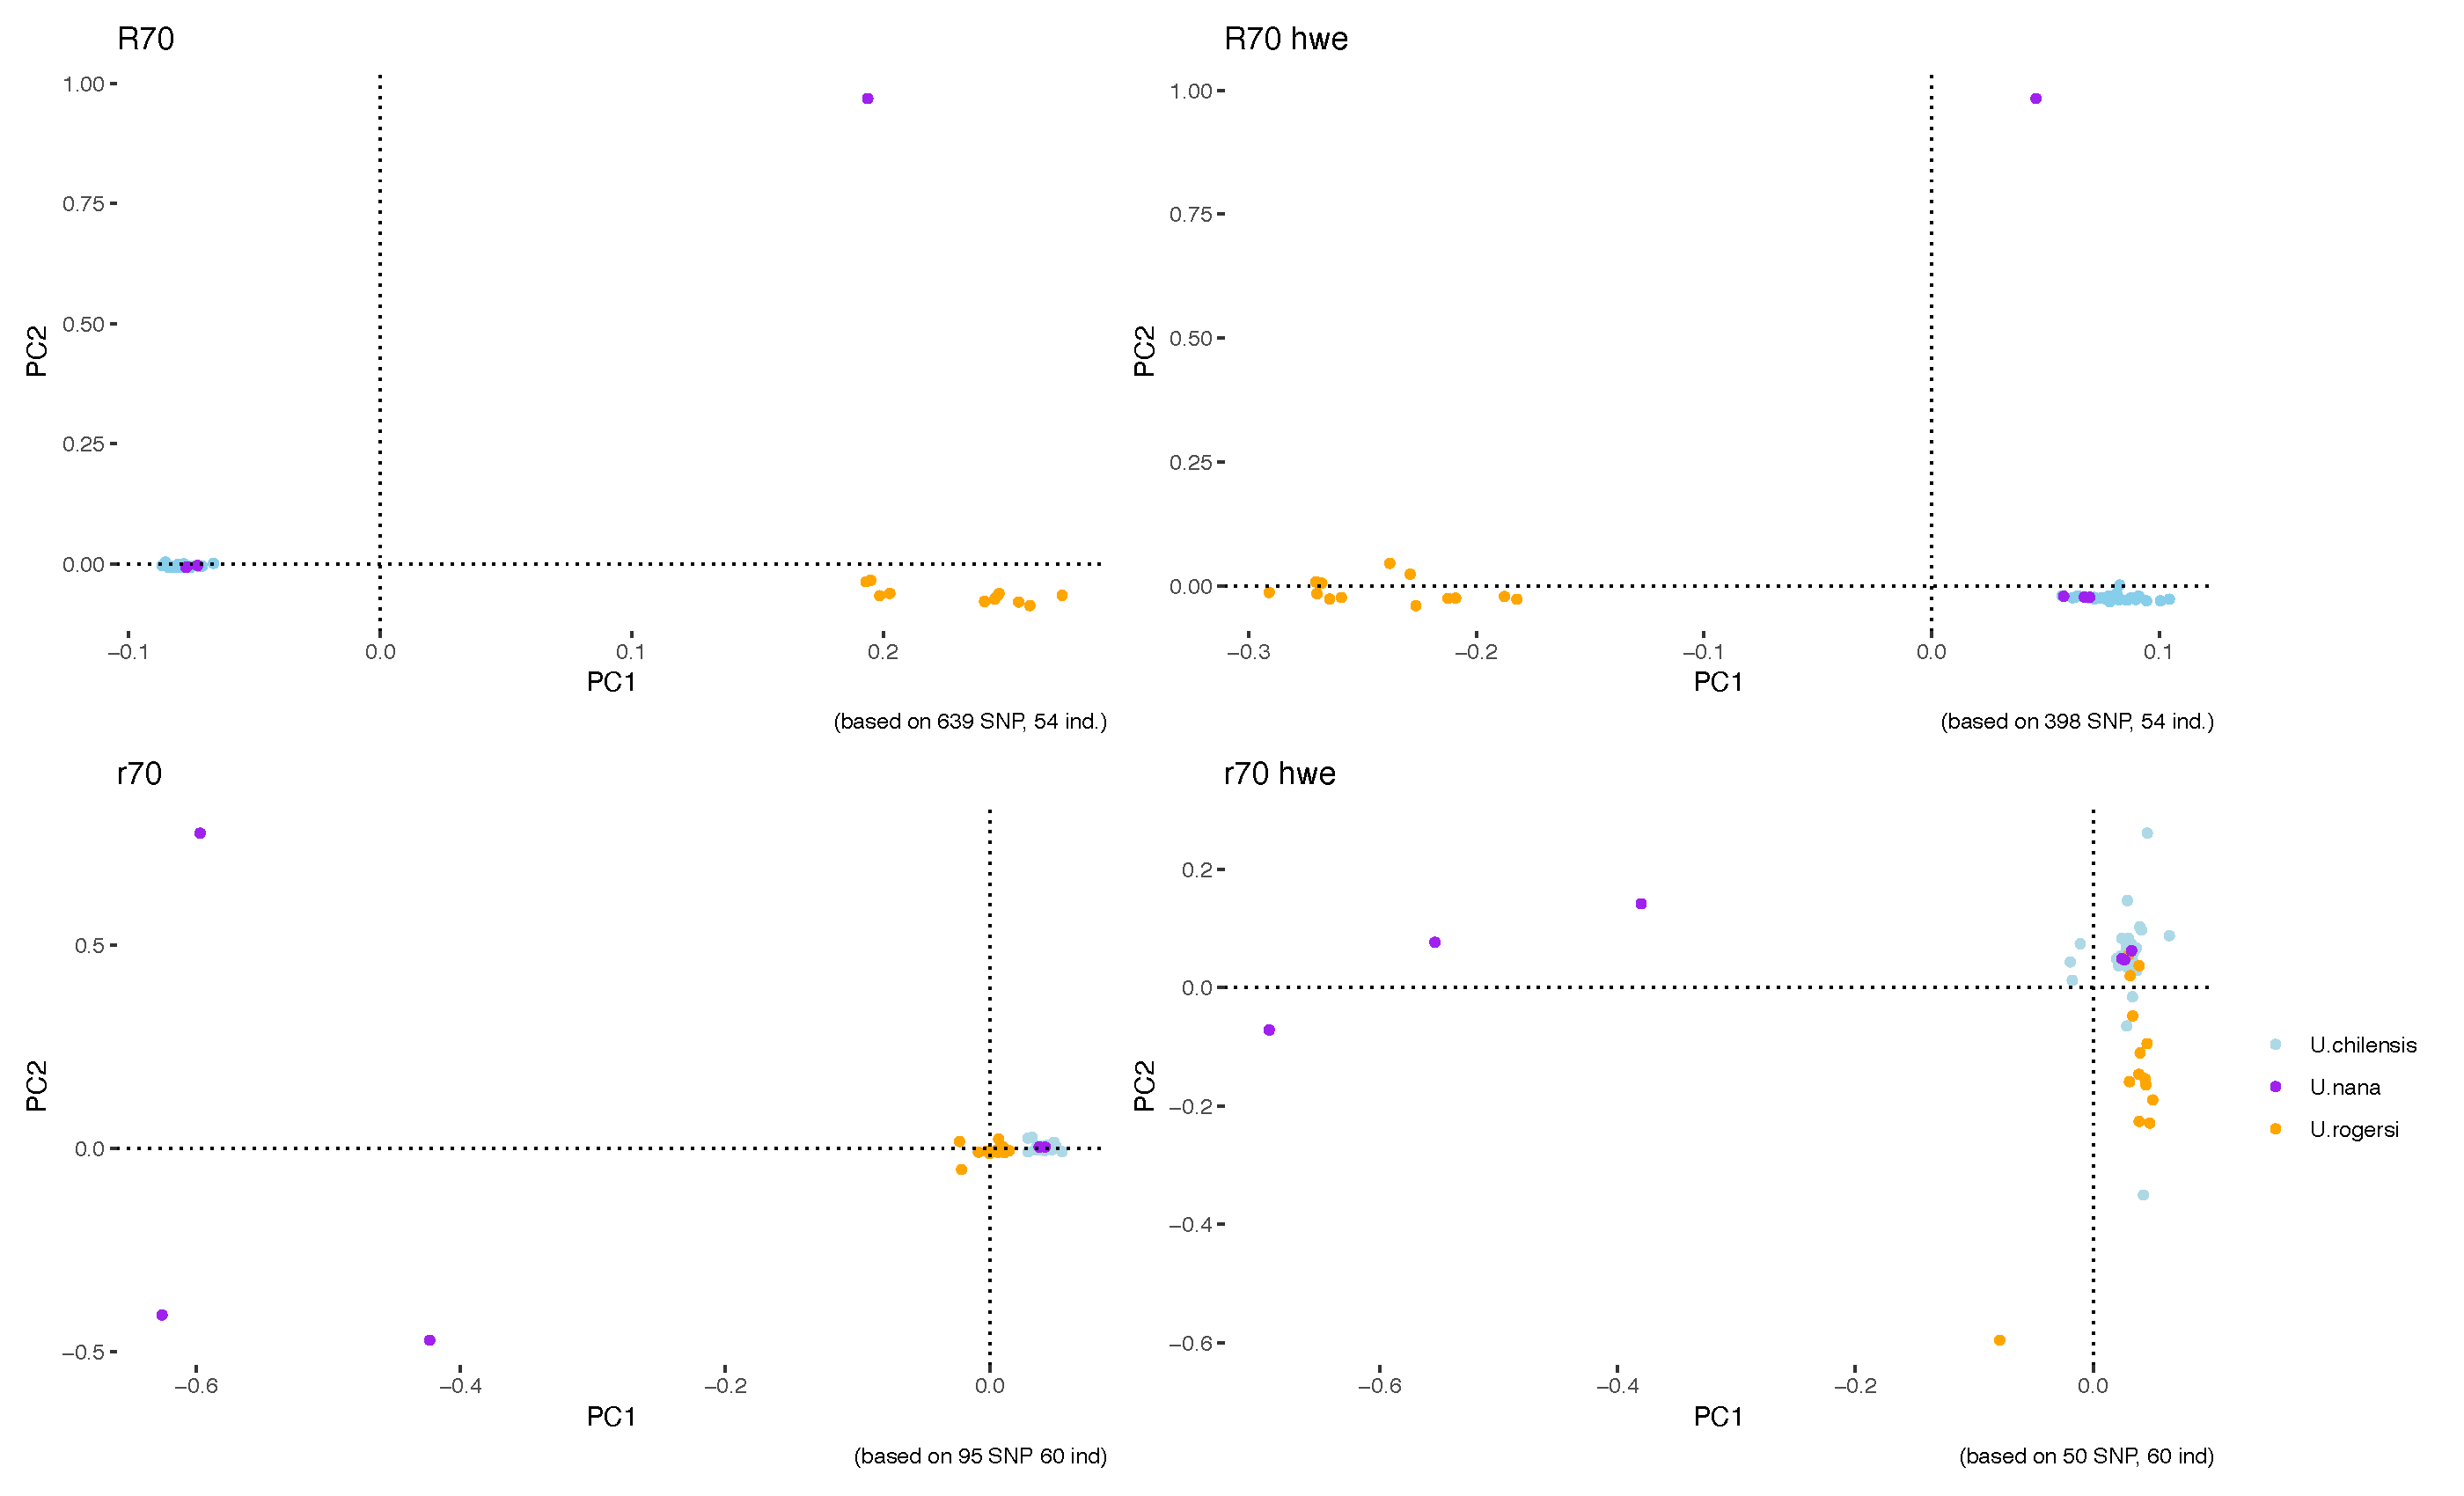
Figure 1: The results from the Principal Component Analysis (PCA).
Figure 1 shows the four main results we got by using different filters and settings in the computer programs. The figure includes four graphs: the two at the top show results based on the minimum percentage of individuals needed across species for a DNA change (SNP) to be processed (R), while the two at the bottom focus on the minimum percentage required within a species (r). The graphs on the right include only SNPs that meet something called Hardy-Weinberg equilibrium (HWE), meaning the frequencies of those DNA changes remain stable over time in a population. In all four graphs, each dot represents an individual, and the colours indicate which species they were assigned to based on physical features (morphology).
The top graphs are based on hundreds of SNPs—639 on the left and 398 on the right—and include data from 54 individuals. Both graphs show similar patterns: the blue species (Urotrygon chilensis) and the purple species (Urotrygon nana) are grouped closely together, while the orange species (Urotrygon rogersi) appears more separate. One Urotrygon nana individual stands out, far from the two main groups. The bottom graphs use fewer SNPs—95 on the left and 60 on the right—but include a few more individuals (60 in total). These graphs show one large group that includes most individuals from all species. Still, in both bottom graphs, three Urotrygon nana (purple) individuals appear far from the main group. This difference happens because the program’s filters used in the top graphs removed two of those Urotrygon nana individuals from that dataset.
As a preliminary conclusion, we think that Urotrygon chilensis individuals can sometimes be mistaken for other species based on their physical features (morphology). The single Urotrygon nana (purple) individual that stands out in the top plots is actually one of the same three that are separated in the bottom plots, but the analysis program’s filters removed two individuals from the dataset used for the top plots. We believe these isolated spots likely represent the true Urotrygon nana individuals. The purple dots that cluster closely with Urotrygon chilensis are probably actually Urotrygon chilensis that were misidentified as Urotrygon nana.