Defining what a ‘positive’ means
So, in the last blog post, we established that there’s much more involved with environmental DNA (eDNA) research than simply taking water samples, sending them to a genetics lab, and finding out if your target species was detected. Taking steps to avoid false negatives (e.g., using a small filter pore size and the most sensitive droplet digital PCR techniques, filtering a large enough volume of water) and false positives (e.g., rigorous primer testing, bleaching everything) is key, especially when conducting research on rare species that likely require special management and conservation actions. The goal of this post is to define what a “positive” means.
It sounds simple, but understanding what a positive represents is an important part of eDNA research. If possible, the procedure involves using negative controls to ensure that no contamination occurred at any stage during the process (i.e., water collection, filtration, DNA extraction, and PCR), sampling ambient water in occupied habitat, catching your target species and taking a sample when it is added to a container, and sampling the water after known time increments. For most eDNA studies, sampling ambient water in occupied habitat may be the only option, but since we have an active smalltooth sawfish tagging program, we wanted to go further to maximize our insight.

A juvenile smalltooth sawfish in a container during the positive sample trial. This research was conducted pursuant to NMFS ESA Permit No. 21043. Photo © Nicole Phillips
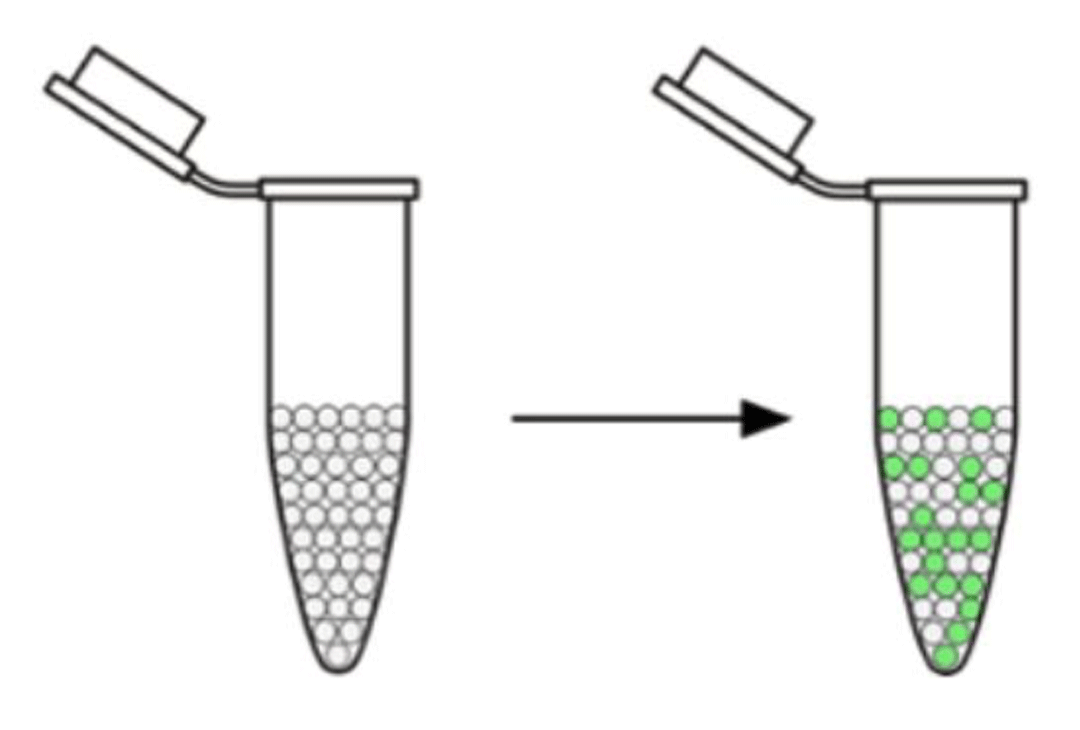
So before showing you what some real data look like, a brief summary of how the droplet digital PCR (ddPCR) platform works is necessary. The platform takes 20–25 microliters of a water sample and looks for DNA in each of up to 20,000 droplets. Droplets with the target DNA glow (green in the figure) and are read by the machine as positive. Droplets without target DNA do not glow and are read as negative. Pretty cool, eh?!

The droplet digital PCR machine looks for DNA in each droplet of the original sample (left). Droplets containing the target DNA glow green and are read as positive.
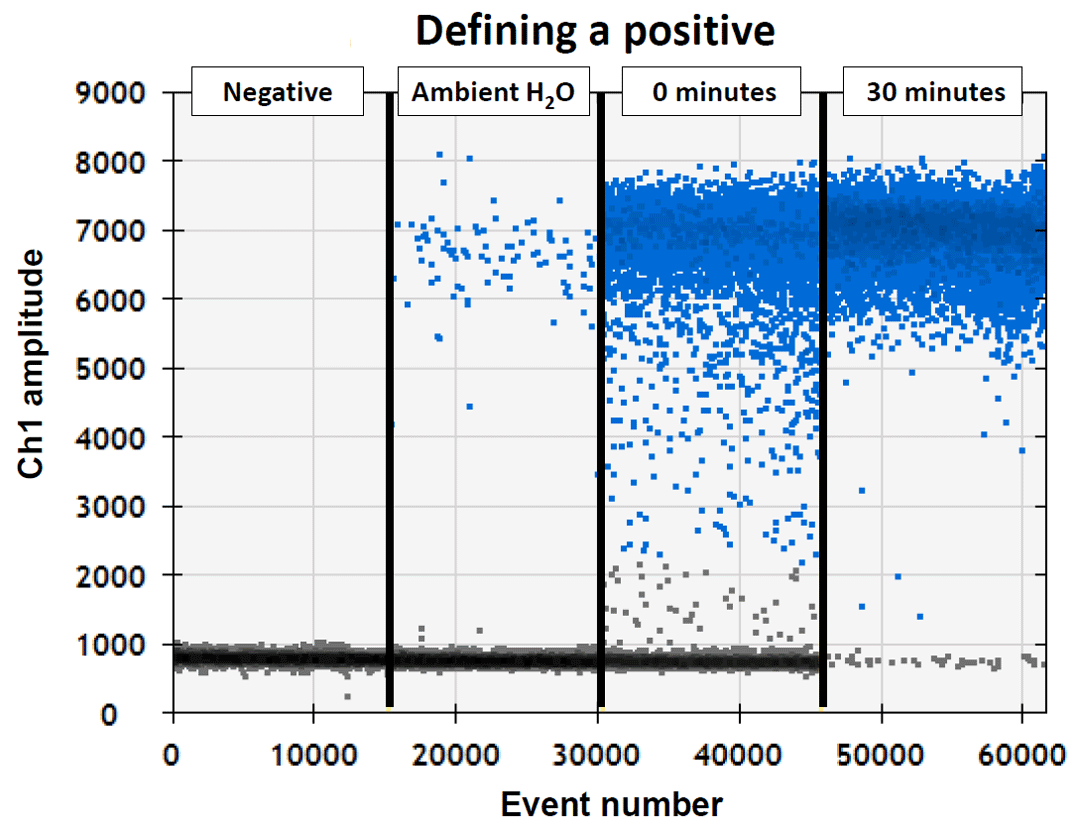
Now for some real data! Our collaborator Dr. Nicole Phillips came to our lab in Port Charlotte, Florida so we could take some water samples to help us define what positive samples will look like when we start our field sampling. She has been studying different species of sawfish for many years, but hasn’t seen many in the wild, so needless to say she was looking forward to this! The data we collected that day before releasing the small sawfish back into the Caloosahatchee River allowed us to visualize how different types of positives will look during the project (see figure and caption).

Image © Ryan Lehman
First, negative control samples were used to ensure that there was no contamination during the trial or sample processing (“Negative”). Notice the gray dots clustered at the bottom of the graph; these did not glow when the droplet digital machine tested them for smalltooth sawfish DNA, so they were all negatives. Next, a water sample was taken from the middle of the Caloosahatchee River, which is a known, occupied nursery for the species (“Ambient H2O”). Notice how there are a few blue positives, but mostly gray negatives. Next, we caught a sawfish and took a water sample immediately after it was added to a container (“0 minutes”). Notice how there are many more blue positives than the ambient water, but still lots of gray negatives. While monitoring the dissolved oxygen to keep it safe, we kept the sawfish in the container for 30 minutes and took another water sample (“30 minutes”). Notice how after 30 minutes, almost all the dots are blue positives and there are only a few gray negatives.

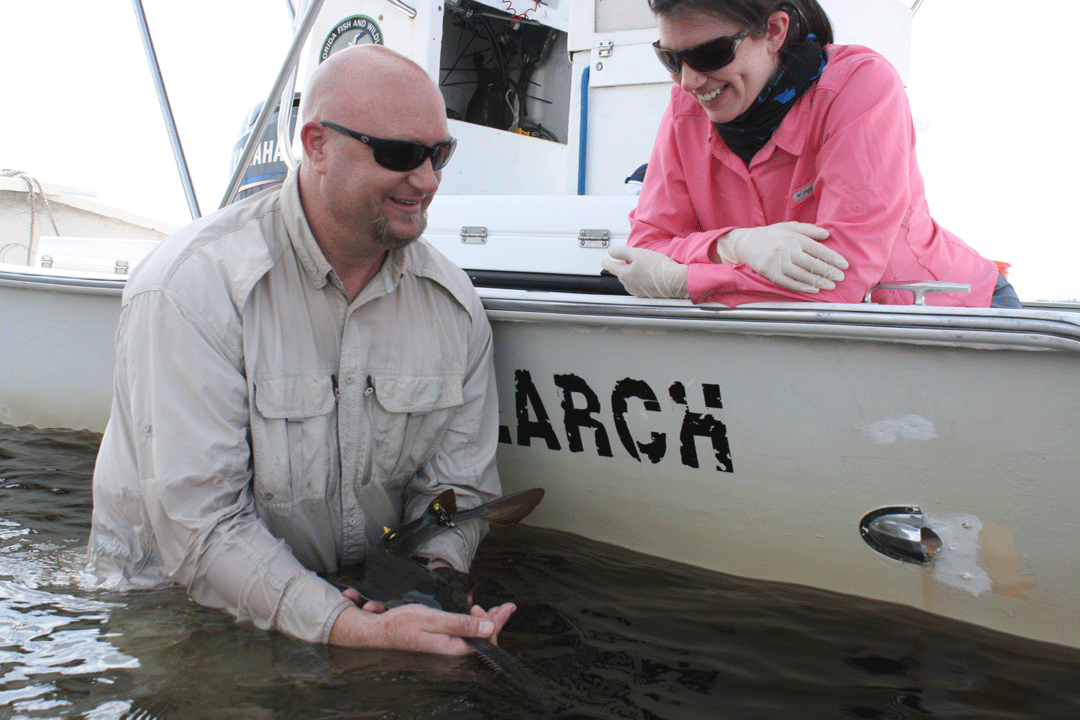
Nicole Phillips and Gregg Poulakis just before the juvenile smalltooth sawfish was released after conducting the positive sample trial. Even though she really (really!) wanted to, Nicole couldn’t hold the sawfish because she might contaminate the samples, but she was still happy to see it! Photo © Rachel Scharer
That’s it for now, but look for updates in an upcoming blog about the importance of collaboration and communication to maximize the success of scientific research on rare species, especially when maximizing conservation impacts and informing management actions are priorities.
