Warning: too much TV can be bad for your health…
One of the often-stated facts of life about tropical marine research goes something like, ‘Visiting exotic locations and studying interesting creatures in the water is fun; sitting at your desk writing papers and analysing data is not.’
There are many caveats to this generalisation – field work is hard. It means long days and trying to do as much as you can in a very short time. It is especially not fun when you’re seasick, the weather is horrible, the boat is sinking or has sunk, and you’re not getting the samples/sharks/data you desperately need. However, sinking boats and seasickness aside, most of the marine scientists I know would rather be sitting on a boat or diving on a reef than settled in front of their computers, buried under e-mails and reports or running data analyses.
That being said, data analysis can be a lot of fun – and even when it’s not, it is essential to science. Data analysis is the process of uncovering the trends and patterns hidden in the samples or numbers; it’s the analysis that reveals new things about your species. Unless you’re lucky enough to turn up something major – like a new species – in the field, most scientific discoveries will emerge slowly through the long and painstaking process of processing and analysing data in the lab or at a desk. This is especially true of any sort of audio and video recording, like the Baited Remote Underwater Video Systems (BRUVS) we used during our recent expedition to One Tree Island on the Great Barrier Reef to survey batoids and look for porcupine rays.
BRUVS have a lot of benefits. They are a very efficient sampling method as they attract mobile species from a wide area into the field of view. You can use multiple BRUVS at the same time, and once they’re in the water they just sit there filming while you go and do something else, like a snorkel survey or repairs to your gear. They collect information about ‘everything’ that shows up on the video, which means sometimes you get surprises. BRUVS data can be analysed in a whole range of ways, and different types of data tell you different things. BRUVS also collect a permanent video record of the biodiversity and behaviour of sharks and rays that can be archived, shared and re-analysed later. In short, BRUVS are great to use in the field. There is one problem, though: back in the lab, someone has to watch all the tape and extract and code all the data from the videos.
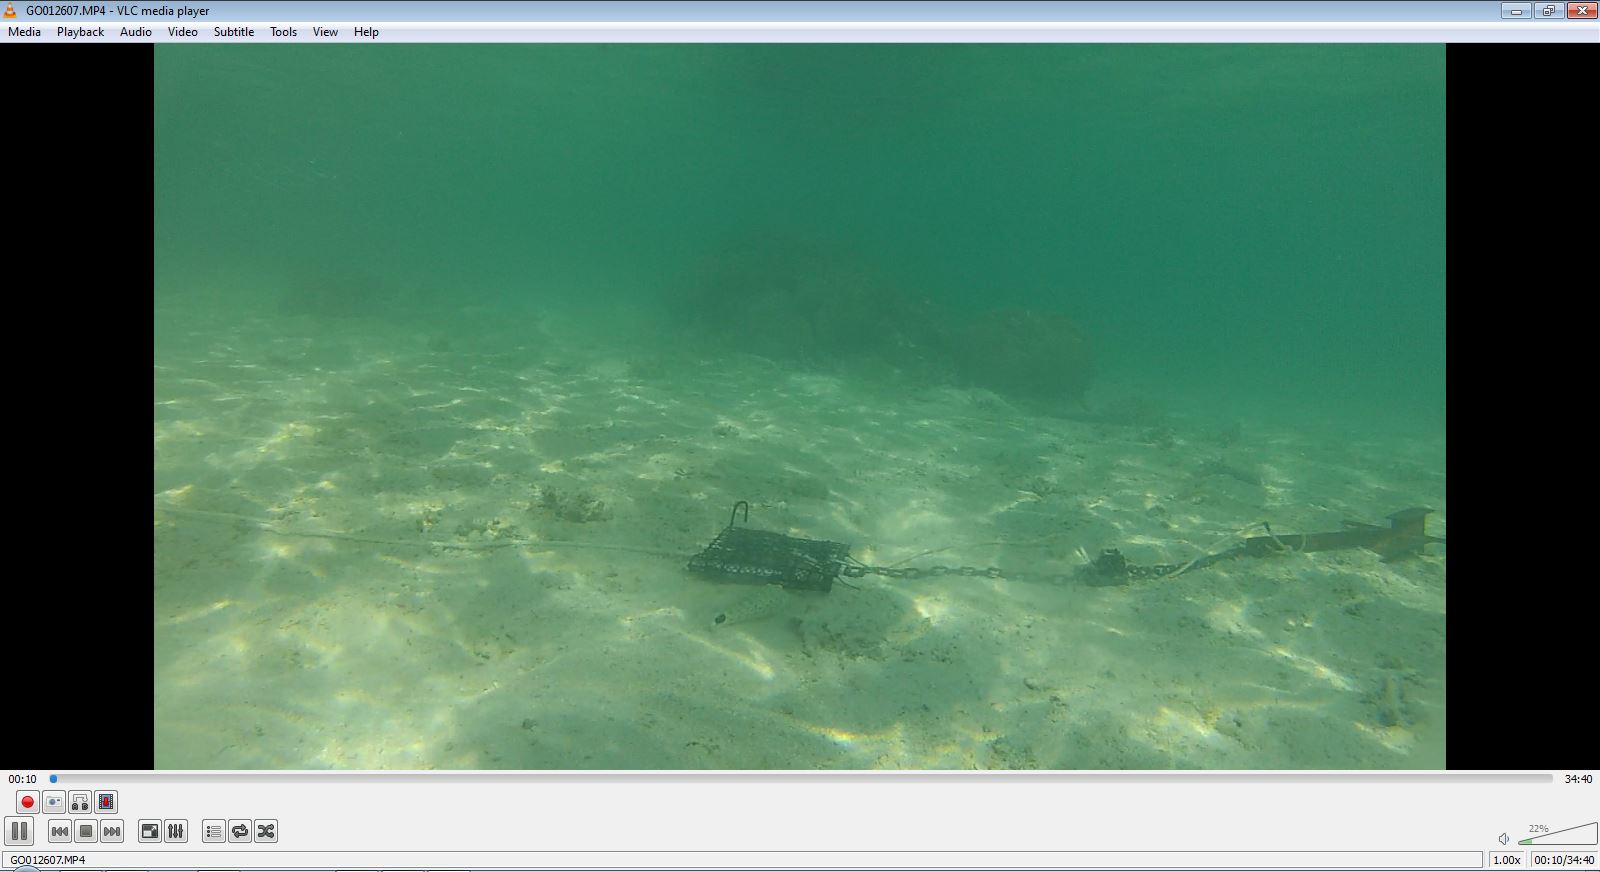
BRUV-TV-1: Watching BRUV TV means getting used to looking at a lot of empty water.
During our recent trip to One Tree Island, we collected 117 hours of BRUVS footage. Someone now has to watch this footage – what we call ‘BRUV TV’ – for 117 hours, making notes on all occurrences of sharks and rays in the video and recording their behaviour. To put this into perspective, this is equal to watching all five seasons of Game of Thrones not once but twice (including all the advertisements) and stopping the video and recording data every time someone dies. Watching BRUV TV can be mind-numbing, and extracting the data from the videos is just the start of the data processing and analysis process!
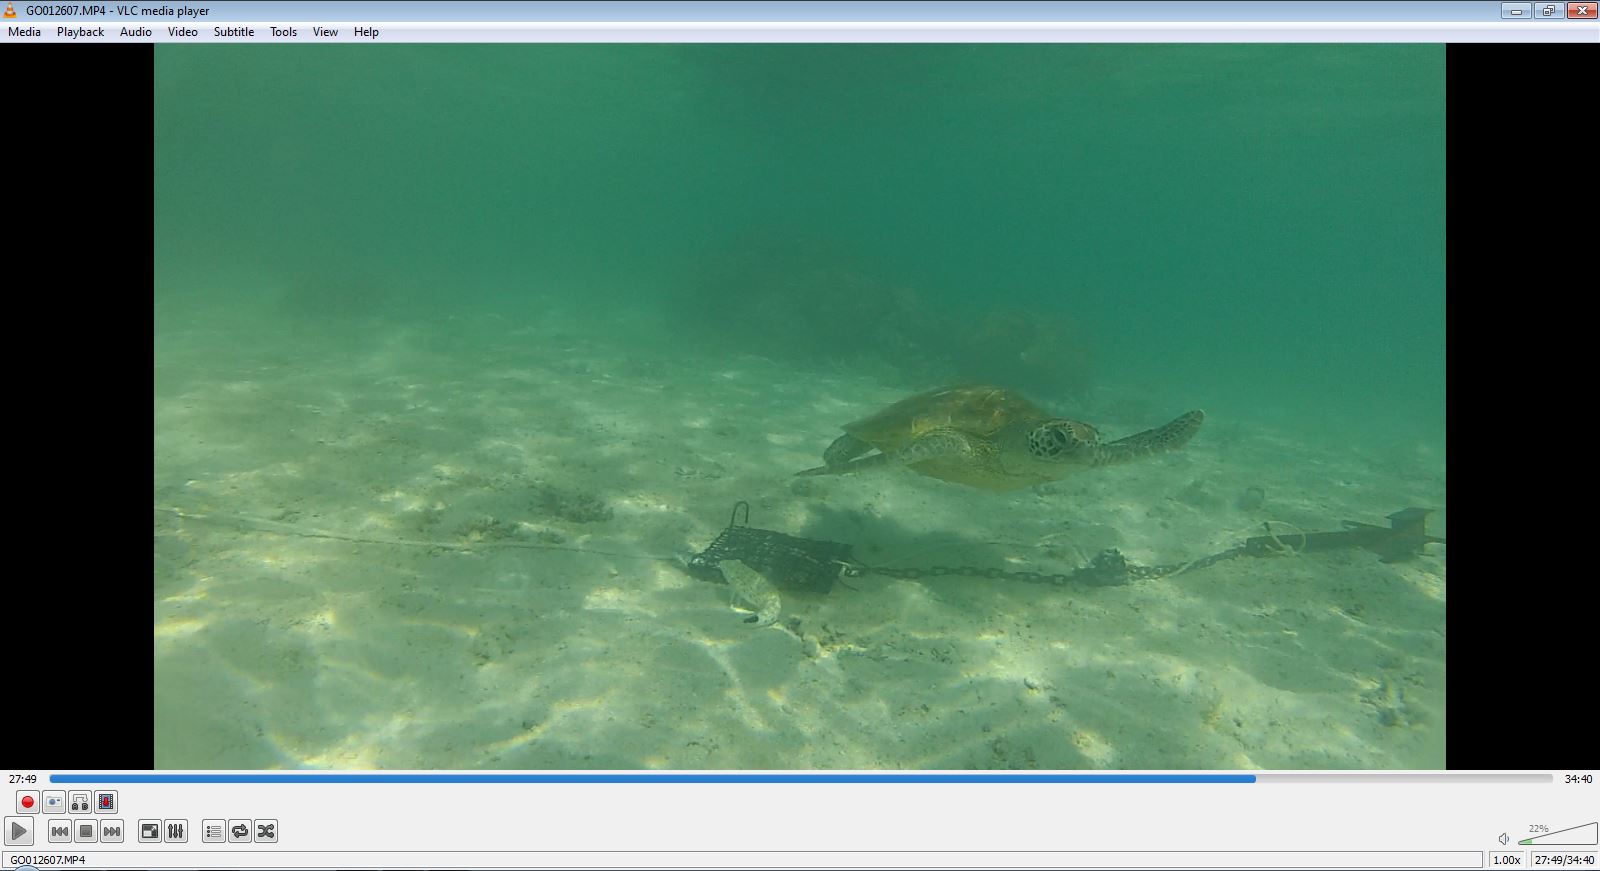
BRUV-TV-2: Sometimes surprises show up on BRUV TV, which is really nice if you’ve just watched 78 minutes of empty water.
Fortunately, we do have help. Firstly, we use special video software to watch the videos at 4x speed and, because we’re looking for big objects (sharks and rays) in clear water, we can watch the tapes at this speed and be confident that we’re not missing anything (we tested viewing at different speeds to find one that is suitable). Also, we have a student who is analysing the tapes and the data as part of her Master’s project. Darryn Sward has bravely joined the team and will watch, code and then analyse this mass of video data. She’s already off to a good start, having read through a large pile of scientific papers on BRUVS techniques. Using this ‘literature review’, we have selected the types of data we’re going to extract from the video footage and she is well into watching BRUV TV and extracting the relevant data. From these data, we will analyse the trends and patterns using statistical models to figure out where and when rays are most likely to be seen at One Tree Island. This can tell us whether factors such as tide or time of day influence how rays use the different habitats and locations.

BRUV-TV-3: Sometimes you get a lot of ‘action’ on one particular BRUVS deployment, with a whole range of species showing up. These are great videos to watch and they can yield lots of data.
The next project blog will be written by Darryn and she will explain more about what she’s doing and what sort of trends are emerging. In the meantime, I am putting together a video of BRUVS highlights from the One Tree Island expedition, so watch this space – we have more news on the way!