The not so sleepy sleeper shark
Part 4: the not so sleepy sleeper shark
With the data from four tagged sleeper sharks now in hand, the next task was to go about making sense of it all. When a tag transmits data to satellites, it only sends a portion of the dataset that it has recorded in its memory. As such, our transmitted datasets consisted of measurements of depth, temperature, and light level recorded at 10-minute intervals for the final five days of the tag deployment. For the preceding 25 days, it gives only a summary of each day’s data, such as the highest and lowest depth and temperature recorded per day. If you wanted access to the entire dataset, you’d need to physically retrieve the tag from the ocean and download it directly to your device, which we did for the one sleeper shark we tagged off the R/V Malolo. This gave us depth and temperature records at one second intervals for the entire 30-day period, and let me tell you, that’s a lot of data to work with.

Project leader Mike Wang holds an electronic tag after the PIER team located and retrieved it with a radio direction finder, a challenging task on the open ocean. It has popped off a sleeper shark the previous day. Photo © Scott Aalbers
An initial look into the numbers gave us some general trends. The sharks we tagged in this study ranged in size from 1.5 to 2.1 meters. They occupied depths from 219 to 1323 meters, with an average depth of 427 meters. Their horizontal displacement, or the straight-line distance from the site where they were tagged to where the tag popped off the shark, ranged from 3.9 to 145.1 kilometers. Although these numbers did not hold any major surprises, they were nonetheless extremely important, as they were the first of their kind for sleeper sharks off California.
It wasn’t until we looked a bit deeper that things got really interesting. Since we had a very fine resolution look into the depth records of the one shark for which we were able to retrieve and download the tag, it enabled a more in-depth analysis of its movement patterns and behaviors. One metric we looked at was vertical rate of movement, or the rate at which the shark moves up and down the water column. Now I don’t know about you, but I expected the movements of sleeper sharks to be, well, sleepy. However, the data recorded from this particular shark show that this is not always the case. We instead observed a near constant state of movement up and down the water column in a regular, oscillating pattern. In fact, vertical rate of movement was greater than 0.5 meters per minute (a zero-value indicating no movement) for 97.4% of the deployment. This shark almost never sat still!
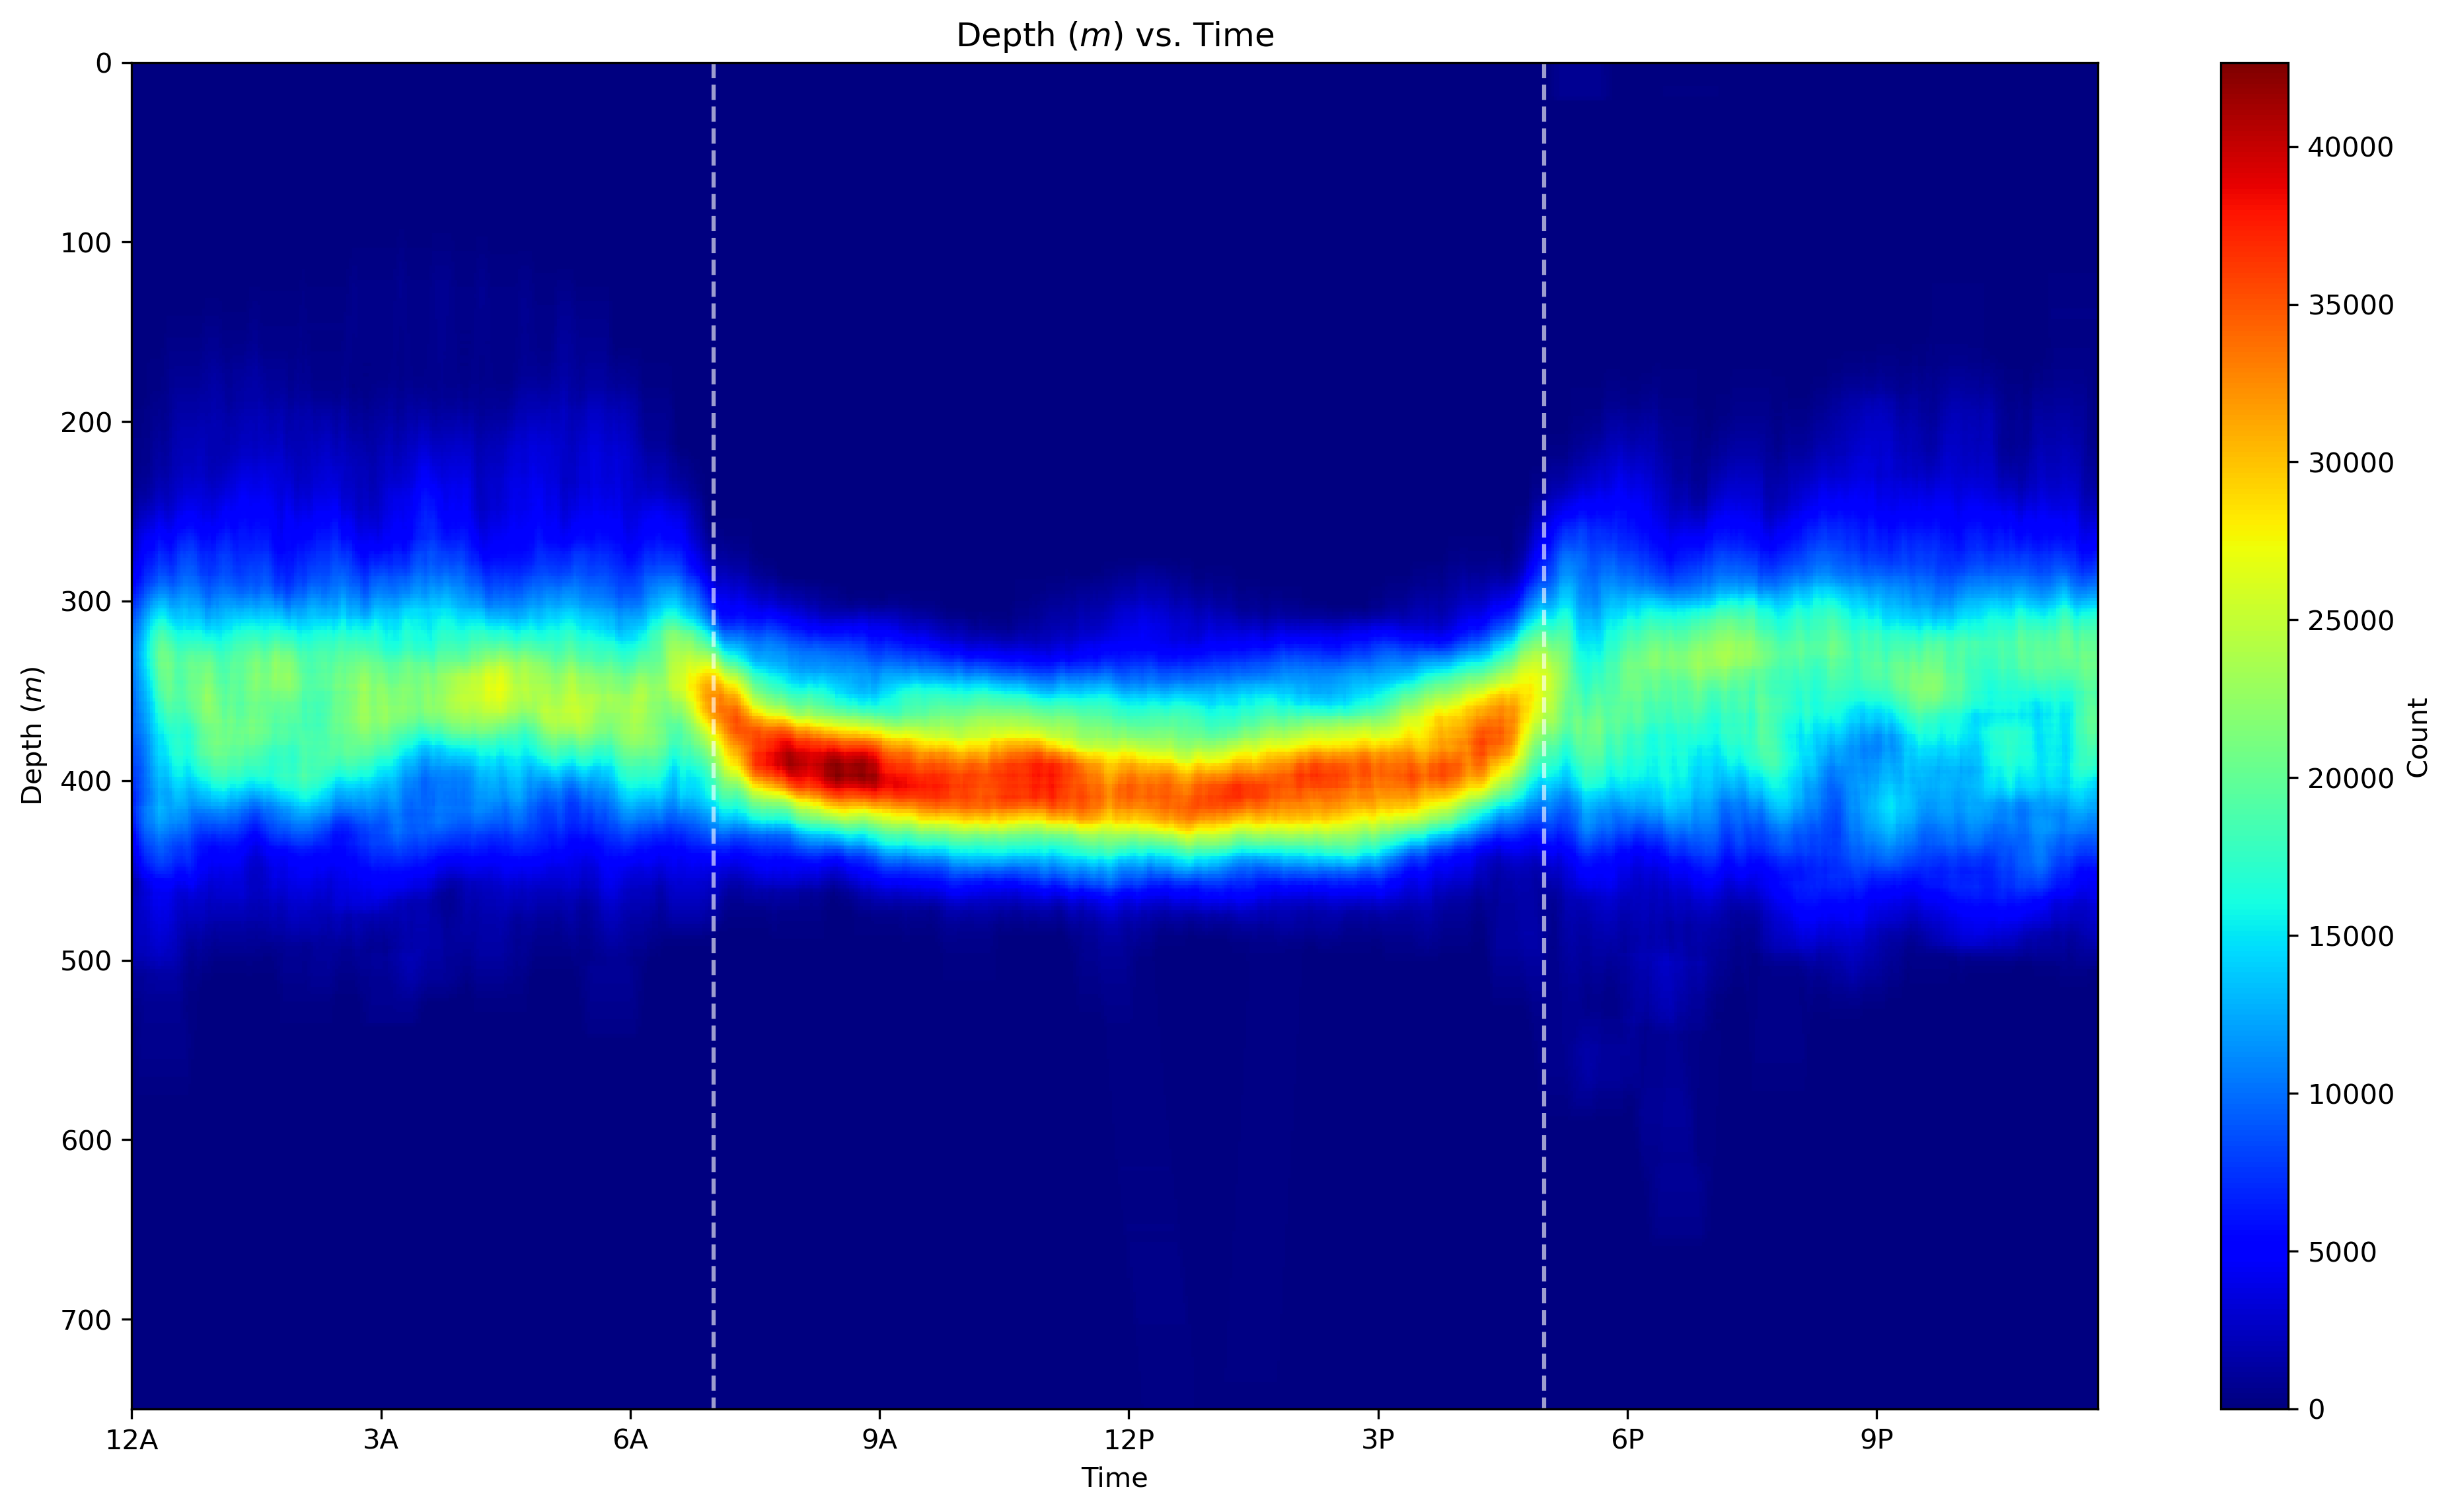
We also identified in this shark a pattern of movement called diel vertical migration. This is a behavior in which an animal occupies shallower depths at night than during the day, “migrating” up and down the water column. This can be seen in the numbers but is really striking when seen visually in a scatter plot such as the one shown below. In this plot, you can clearly see the shark starting deeper at noon of the first day on the far-left side of the x-axis, moving shallower at night, which is the time period represented by the middle of the plot, and again moving deeper the next day towards the right side of the plot. Diel vertical migration, as well as the oscillating swimming pattern we observed are both proposed to be related to foraging for food by Hulbert and his colleagues[1], who performed a sleeper shark tagging study in the Gulf of Alaska in 2006.

A visual representation of 24 hours of sleeper shark vertical movements. The white, dashed vertical lines denote sunrise (left) and sunset (right). Note that the shark’s movements are on average deeper and have a narrower range during the day than at night. Illustration © Bryce Chudomelka
Sleeper sharks are a fascinating shark species, in part owing to their elusive and mysterious nature. The findings presented in this study are just a tiny glimpse into their lives, and they are certainly no less mysterious for it. While far more tag deployments are needed to begin to understand their complex lives, I feel privileged and honored to have played a small part in uncovering their mystery, and hopefully, promoting their respect and conservation.
[1] Hulbert, L.B., Sigler, M.F., Lunsford, C.R. 2006. Depth and movement behaviour of the Pacific sleeper shark in the north-east Pacific Ocean. Journal of fish biology. 69, 406-425.
