
Dissecting without a scalpel: digital segmentation of the brain of the smalltooth sawfish
PhD student Maria Pierce (Yopak ZoMBiE Lab, University of North Carolina Wilmington, UNCW) spent several months training in magnetic resonance (MR) image acquisition and scanning numerous brains from opportunistically collected smalltooth sawfish Pristis pectinata (check out our previous blog post to learn more!). This method effectively lets us get high resolution images of the brain – without the need to destroy it.
Acquiring data on P. pectinata brain size and organisation from MR
The smalltooth sawfish can tolerate a wide salinity range, occupying both estuarine and coastal habitats throughout life. Despite this, P. pectinata is still range limited and is primarily found in South Florida and the Western Bahamas, highlighting gaps in our understanding of their biology and ecology. As the brain continues to grow throughout life (see this blog post for more info), this might allow for changes in the relative size of major brain regions in conjunction with ecological shifts. These changes can potentially inform behaviour or how individuals process sensory information throughout life; but how do we measure this?
After fine-tuning our MRI protocols with Dr. Kara Yopak, Dr. Emily Peele, and our talented team of collaborators, Maria has been scanning her brain samples at the Biomedical Research Imaging Center (BRIC) at the University of North Carolina at Chapel Hill (see this blog post to learn more about MR imaging). Due to the size of these samples (which can be quite large), each scan takes several hours to attain high-resolution images that can allow us to identify and “digitally dissect” major brain structures. If you think of a digital photograph as an array of two-dimensional pixels, then you can imagine we have to consider the three-dimensional array of data points generated from MRI, termed voxels.
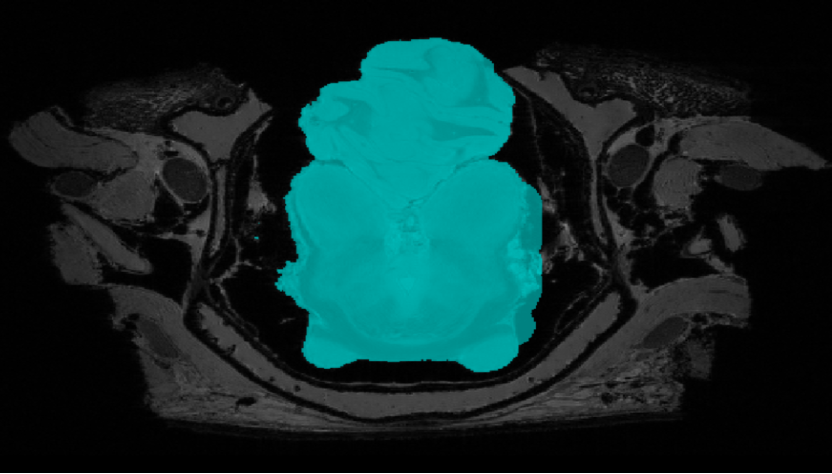
Coronal view of a preliminary P. pectinata scan after segmentation using ITK-SNAP®. Photo © Maria Pierce
Our scan data are digitally “dissected” (or segmented, as we call it) using special software called ITK-SNAP® (pictured above). In this software, we identify the brain or a brain region of interest by labelling these voxels in different colours (for an example, see the image below). The program will then give us key information – including size of the brain regions we have labelled, by adding up all of those voxels.
Maria is going to spend the next several months completing her scans and segmenting all of the 3D data from P. pectinata samples, in order to start to generate 3D renderings of the brain (visualised below on the right) and take brain measurements. This will allow us to compare brain morphology across batoids and throughout ontogeny in P. pectinata.
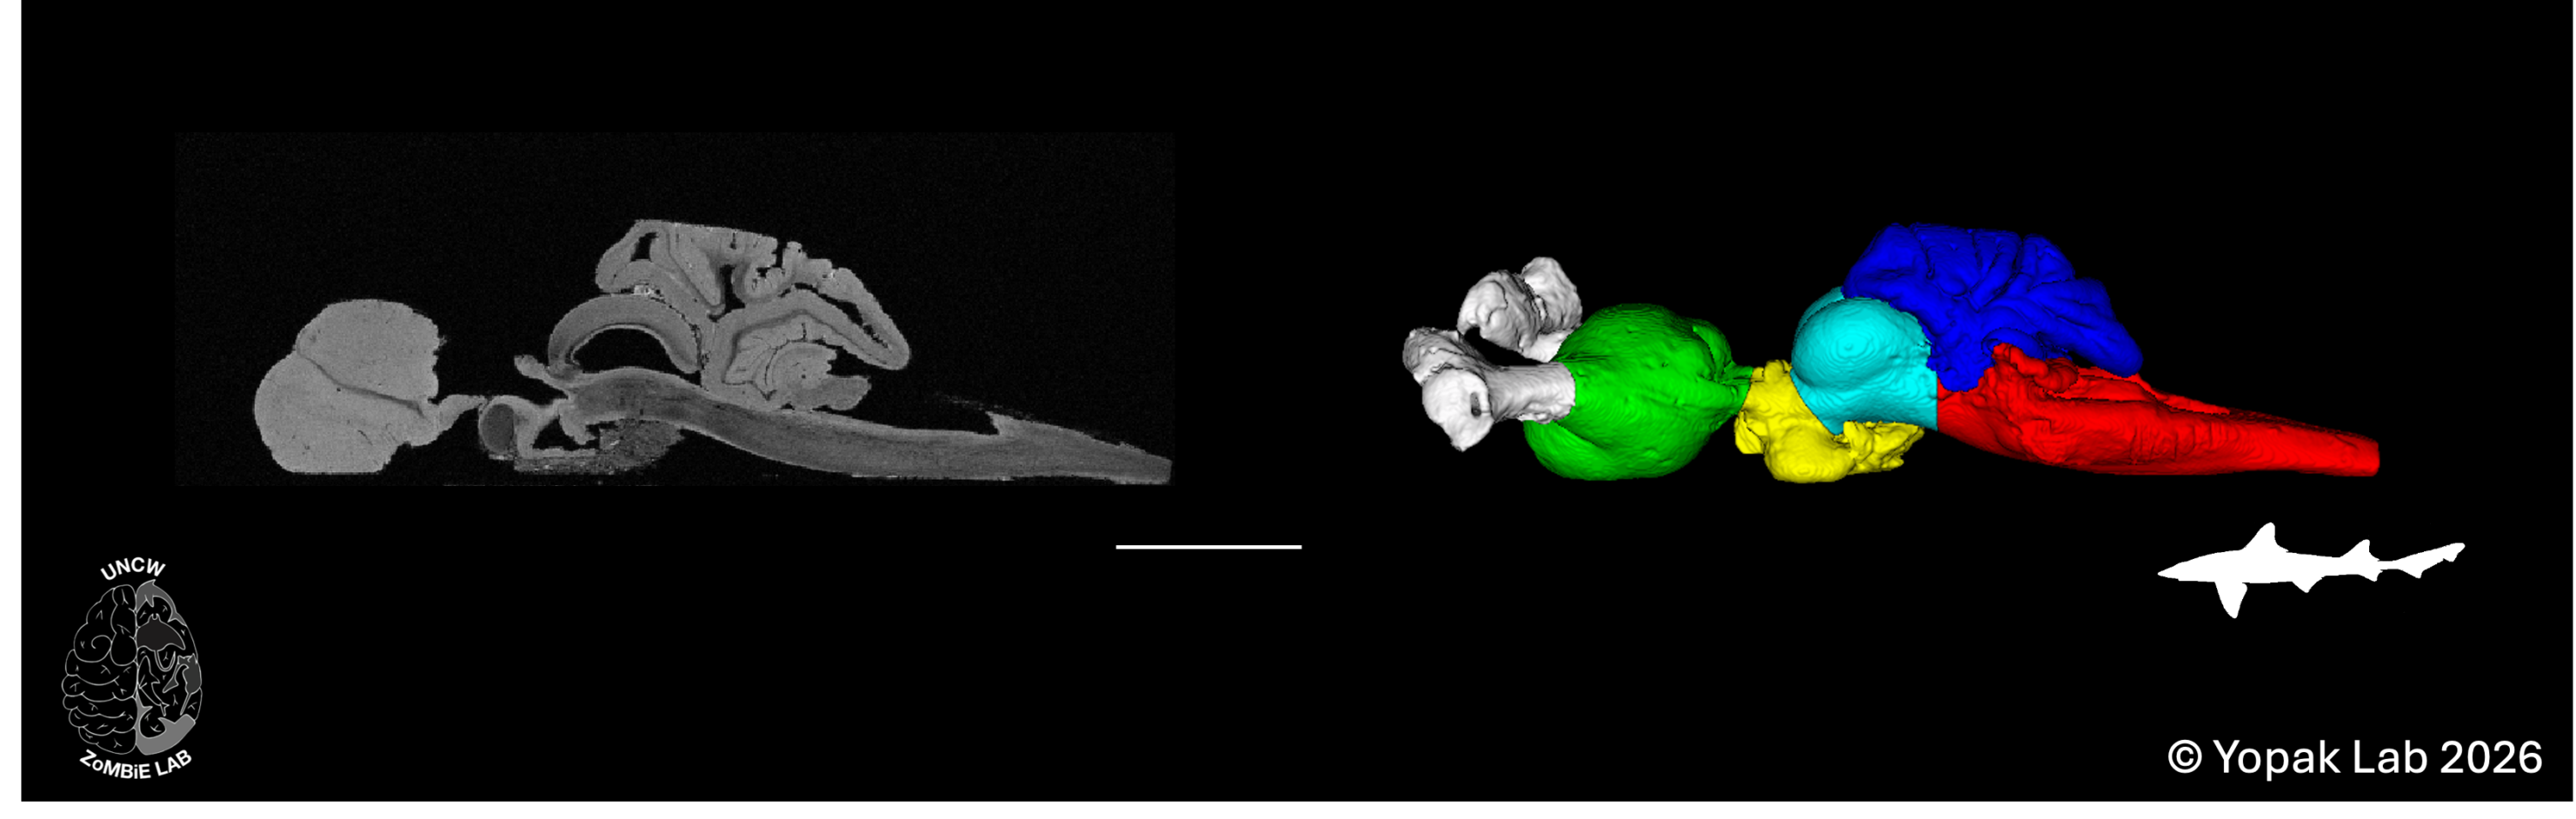
(left) An example sagittal section of an MRI scan of the brain of the Dusky Smoothhound Shark (Mustelus canis), (right) including a digital “dissection” of the scan into six major brain structures of the brain in lateral views. Key: olfactory bulbs (white); telencephalon (green); diencephalon (yellow); mesencephalon (light blue); cerebellum (royal blue); medulla oblongata (red). Scale bar = 1 cm. Figure adapted from Yopak (2022)
A project such as this requires collaboration across a massive team of amazing researchers. In addition to support from SOSF, this work is bringing together FWC, the Fish and Wildlife Foundation of Florida, Havenworth Coastal Conservation, and the Bonefish Tarpon Trust
Want to read more about some of our lab’s work discussed above? Check out our publications page!
**Reference:
Yopak KE. 2022. Advances in Chondrichthyan Neurobiology. In Biology of Sharks and Their Relatives, Edition 3. New York: CRC Press. pp 105-142 ISBN 9780367861179